Views, filters, and reports
Views, filters and reports let you drill down into your data in a variety of ways.
Views and Filters
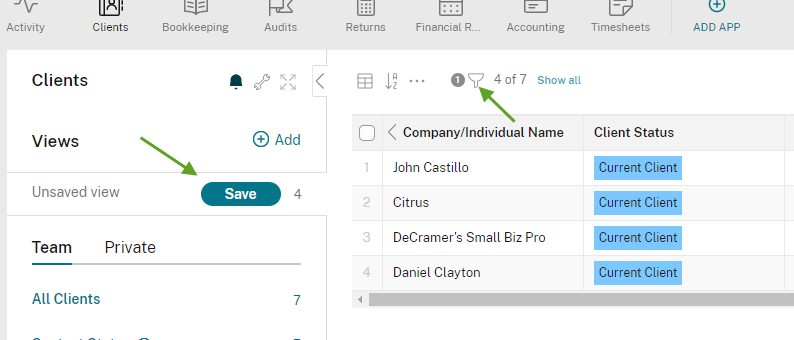
Use the filter menu at the top of your app to create a new filter, then click the “Save” button in the upper left to create a new view.
Notes:
You can filter based on app reference fields, contact fields, category fields, date fields, number fields, and tags.
Emojis are not supported in view titles.
Text fields are not able to be filtered on an app as filtering all possible options requires a pre-selected value. The text allows for a variance.
You can use the Organization field in the Contact app or Tags to filter on text as an extra tip - this can help filter on text variables in those specific fields.*
All views will be divided into team views, which are visible to all workspace members, and private views, which are visible only to you. Use the wrench icon next to any view to switch between team views and private views.
You can drag and drop the views in both lists to re-order them as necessary.
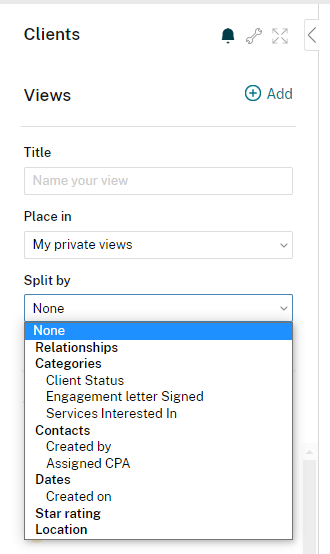
Your views can now have sub-groups to keep them organized. For example, you can group your projects by assignee to see an overview of how many projects each of your colleagues are working on, then click to view the projects in detail. You will find the option to create these sub-groups when saving your view.
Saved view limit: There is a limit to 15 sub-groups that can be shown in a view. If your filter has more than 15 sub-groups, some of them will not be shown.
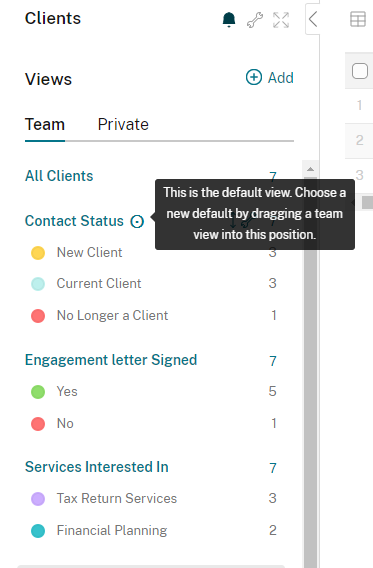
The default view for your app will be the first view in the team views, after “all items”. You can use this to decide exactly what your team members should see when they first visit your app.
Last Used View
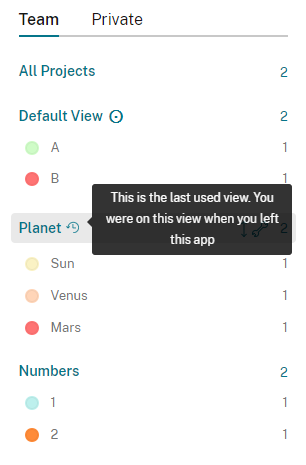
When you use a view, that view will be moved towards the top of your team views, located under your “all items” and “default” for easy access again. The “clock” icon located next to the view name lets you know which one you last used. In the Private view pane, the last used view is pushed up to the top of your list of views.
Its not permanent though, clicking a different view in either pane will clear it as the most recent one. All of your views are still ordered how you originally placed them.
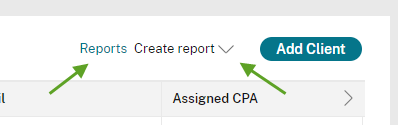
Reports
Your reports and other tiles are available in an overlay via the “Reports” button in the upper right when viewing your app. From here you can build a clear overview, including helpful text and images, so you and your team can see exactly what’s going on in your app.
To add a new report, click the Add tile button at the bottom of the overlay.
You can also select different layouts for your reports to visualize your data. Learn more about visual reports in this article.
Check out this video tutorial for an in-depth walk-through of creating views, filters and reports:
The reports can be rearranged by drag and drop to get the overview in your preferred order. This format will be consistent for everyone who views the overlay.