This content has been machine translated dynamically.
Dieser Inhalt ist eine maschinelle Übersetzung, die dynamisch erstellt wurde. (Haftungsausschluss)
Cet article a été traduit automatiquement de manière dynamique. (Clause de non responsabilité)
Este artículo lo ha traducido una máquina de forma dinámica. (Aviso legal)
此内容已经过机器动态翻译。 放弃
このコンテンツは動的に機械翻訳されています。免責事項
이 콘텐츠는 동적으로 기계 번역되었습니다. 책임 부인
Este texto foi traduzido automaticamente. (Aviso legal)
Questo contenuto è stato tradotto dinamicamente con traduzione automatica.(Esclusione di responsabilità))
This article has been machine translated.
Dieser Artikel wurde maschinell übersetzt. (Haftungsausschluss)
Ce article a été traduit automatiquement. (Clause de non responsabilité)
Este artículo ha sido traducido automáticamente. (Aviso legal)
この記事は機械翻訳されています.免責事項
이 기사는 기계 번역되었습니다.책임 부인
Este artigo foi traduzido automaticamente.(Aviso legal)
这篇文章已经过机器翻译.放弃
Questo articolo è stato tradotto automaticamente.(Esclusione di responsabilità))
Translation failed!
Workflow Automation: Advanced Charting Actions
Advanced Charts can be added to any Create or Update action to update an Image field on a Podio Item.
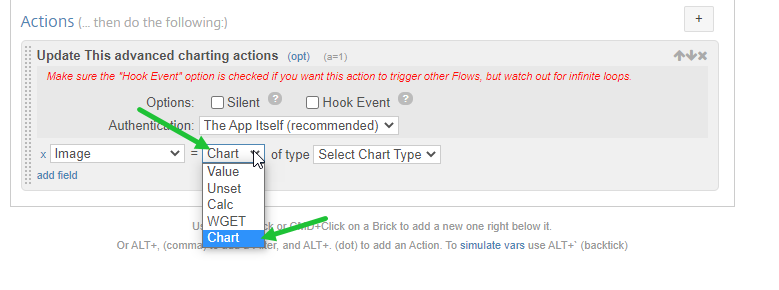
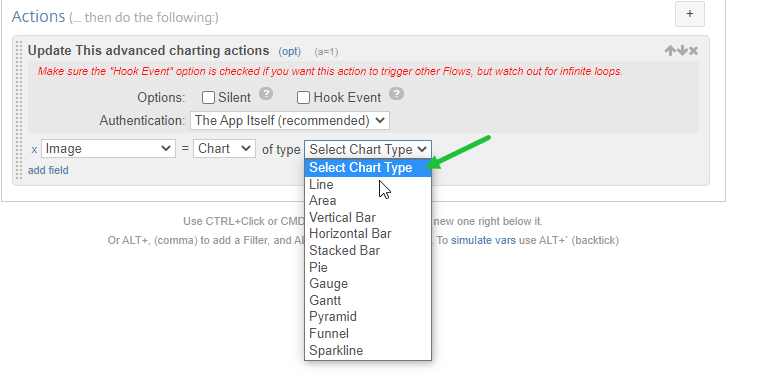
Chart Types include:
-
Line - displays quantitative data, best for a continuous graph
-
Area - similar, based on the line chart
-
Horizontal & Vertical Bar - work best for categorical data
-
Stacked Bar - similar, best for a cumulative total
-
Pie - generally used to show percentage or proportional data of 6 categories or less
-
Gauge - show information as a reading on a dial (speedometer)
-
Gantt - illustrate the start and finish dates of elements in a project
-
Pyramid - best used to show hierarchical structure, as well as quantity or size
-
Funnel - using multiple groupings in an ordered set to show the proportions among them
-
Sparkline - a line chart, typically drawn without axes or coordinates, to show a trend in a series of data
Once the Chart Type is chosen, the Chart Settings become available
-
Choose the Data Source. Select Manual Token List to manually input data and use tokens OR Collected Items to select an items field from a previously collected set of data.
-
Choose the Label. Create a comma-separated list from multiple field tokens OR choose a field from the drop-down menu to use for Labels.
-
Using Series 1, chart the first set of data. Give the Series a Name. Then, create a comma-separated list using the Manual Token List data set, otherwise, choose the field that holds that data to chart on the Collected Item. Even customize the Series Color and Symbol.
-
Choose Add Series to add multiple sets of data on the same Chart.
Other Settings include:
-
Title
-
Design
-
Plot Area
-
Labels
-
Legend
Share
Share
In this article
This Preview product documentation is Citrix Confidential.
You agree to hold this documentation confidential pursuant to the terms of your Citrix Beta/Tech Preview Agreement.
The development, release and timing of any features or functionality described in the Preview documentation remains at our sole discretion and are subject to change without notice or consultation.
The documentation is for informational purposes only and is not a commitment, promise or legal obligation to deliver any material, code or functionality and should not be relied upon in making Citrix product purchase decisions.
If you do not agree, select I DO NOT AGREE to exit.